The following pie chart represents the distribution of form two students who were selected to participate in sports activities. If there are 200 students who were selected, how many students participate in each activity?
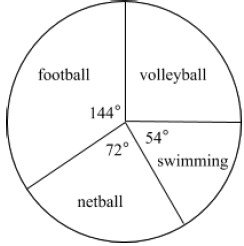
2
The masses of a group of students from Kilimani secondary school were recorded as shown in the following table:
| Mass in kilograms | 31 - 40 | 41 - 50 | 51 - 60 | 61 - 70 | 71 - 80 |
| Frequency | 2 | 5 | 3 | 9 | 1 |
(i)How many students are there in the group?
(ii)State the class interval that has the largest number of students.
(iii)Prepare a table showing the class boundaries and the corresponding cumulative frequencies.
View Ans3
23. The masses of 40 students from the University of Dar es Salaam were recorded to the nearest kilogram as follows:
| 60 | 64 | 63 | 67 | 66 | 68 | 59 | 58 | 59 | 60 |
| 64 | 66 | 65 | 60 | 73 | 70 | 63 | 69 | 70 | 60 |
| 66 | 70 | 74 | 69 | 63 | 69 | 59 | 65 | 64 | 65 |
| 73 | 61 | 62 | 64 | 61 | 61 | 62 | 63 | 58 | 73 |
From the data given, construct a frequency distribution table taking equal class intervals 57 - 61, 62 -66, 67 - 71, … and determine the class interval with the highest frequency.
View Ans4
24. The following table shows marks which were scored by Form One students in a mathematics test at Chilulumo Secondary school.
| Marks% | 40 | 45 | 50 | 55 | 60 | 65 | 70 |
| Number of students | 6 | 8 | M | 5 | 9 | 4 | 3 |
From the table, determine the value of M if the total number of students was 48, hence calculate the percentage of the students who scored at least 55 marks.
View Ans5
The age of students selected o participate in a debate competition were recorded as follows
| 13 | 15 | 17 | 16 | 15 |
| 14 | 16 | 18 | 17 | 16 |
| 15 | 14 | 13 | 16 | 14 |
| 17 | 15 | 16 | 15 | 16 |
(i)Prepare a frequency table showing the ages of students and their corresponding frequencies
(ii)Draw a frequency polygon representing the given information
View Ans6
The following table shows marks for a Form Two History monthly test:
| Marks in % | 25 | 35 | 40 | 50 | 60 | 65 | 70 | 75 | 80 |
| No. of studs. | 2 | 3 | 5 | 7 | 11 | 7 | 4 | 2 | 1 |
(a)What is the lowest mark?
(b)What is he highest mark?
(c)Which mark is scored by the greatest number of students?
(d)If 60% is the pass mark in the test, how many students failed?
(e) How many students are in Form Two class
View Ans7
The marks of 61 students are represented int he following table:
| Mark in % | 30 | 35 | 45 | 50 | 60 | 75 | 80 | 85 | 90 |
| Number of students | 3 | 5 | 7 | 10 | 18 | 9 | 4 | 3 | 2 |
From the table answer the following questions:
(i)Which mark was scored by few students?
(ii)What was the highest mark?
(iii)If 50% was the pass mark in the examination, how many students passed the examination?
(iv)Which mark was scored by many students?
View Ans8
A survey was done among students in a certain school in order to find the most popular subject. In this survey each student voted once and the results were as follows.
| Subject | Maths | Englis | Biology | History | Geograph | Physics |
| NQ of Pupils | 50 | 80h | 120 | 40 | 80y | 30 |
Show this information in a pie chart.
View Ans9
The grades on a Mathematics test taken by 100 students arc as shown in the following distribution table:
| Marks | 50- 59 | 60- 69 | 70-79 | 80- 89 | 90- 99 |
| Number of students | 3 | 21 | 32 | 27 | 17 |
- What is the size of each class interval of this distribution?
- Which class interval had the highest number of students?
- Find the class mark of the highest class interval.
- Find the number of students who passed if the pass mark was 70.
- Use the condition given in 10 (b) (iv), find the number of students who failed the test.
Hub App

 For Call,Sms&WhatsApp: 255769929722 / 255754805256
For Call,Sms&WhatsApp: 255769929722 / 255754805256  MATOKEO KIDATO CHA IV 2023
FORM ONE SELECTION 2024
Matokeo Darasa VII 2023
SECONDARY REGIONAL EXAMS
PRIMARY REGIONAL EXAMS
FORM VI NECTA REVIEWS
FORM IV NECTA REVIEWS
FORM II NECTA REVIEWS
STD VII NECTA REVIEWS
STD IV NECTA REVIEWS
SECONDARY EXAMS SERIES
PRIMARY EXAMS SERIES
PRIMARY SUBJECT NOTES
SECONDARY SUBJECT NOTES
SECONDARY TOPICAL EXAMS
SECONDARY TOPICAL QUESTIONS
PRIMARY TOPICAL QUESTIONS
PRACTICAL EXAMS & NOTES
SECONDARY REGIONAL EXAMS
DOWNLOAD SUBJECT NOTES
SCHEMES OF WORK (PRIMARY & SECONDARY)
LESSON PLAN
SECONDARY LOG BOOKS
PRIMARY LOG BOOKS
LITERARY WORKS / UCHAMBUZI VITABU
METHALI ZOTE ZA KISWAHILI
Vitendawili Vya Kiswahili
FORM VI RESULTS 2023
FORM FIVE SELECTION 2023
Matokeo KIDATO CHA II 2022
Matokeo Darasa IV 2022
MATOKEO KIDATO CHA IV 2023
FORM ONE SELECTION 2024
Matokeo Darasa VII 2023
SECONDARY REGIONAL EXAMS
PRIMARY REGIONAL EXAMS
FORM VI NECTA REVIEWS
FORM IV NECTA REVIEWS
FORM II NECTA REVIEWS
STD VII NECTA REVIEWS
STD IV NECTA REVIEWS
SECONDARY EXAMS SERIES
PRIMARY EXAMS SERIES
PRIMARY SUBJECT NOTES
SECONDARY SUBJECT NOTES
SECONDARY TOPICAL EXAMS
SECONDARY TOPICAL QUESTIONS
PRIMARY TOPICAL QUESTIONS
PRACTICAL EXAMS & NOTES
SECONDARY REGIONAL EXAMS
DOWNLOAD SUBJECT NOTES
SCHEMES OF WORK (PRIMARY & SECONDARY)
LESSON PLAN
SECONDARY LOG BOOKS
PRIMARY LOG BOOKS
LITERARY WORKS / UCHAMBUZI VITABU
METHALI ZOTE ZA KISWAHILI
Vitendawili Vya Kiswahili
FORM VI RESULTS 2023
FORM FIVE SELECTION 2023
Matokeo KIDATO CHA II 2022
Matokeo Darasa IV 2022
WHATSAPP US NOW FOR ANY QUERY
App Ya Learning Hub Tanzania